Posts

[DRAFT] Yugabyte and Postgres - Finding information.

Image
 TL;DR: [DRAFT] Could not resist creating an ERD of tables to collect metrics. I have put "Session" central to my information. Considering it is the application-connect that initiates the session and is the main "customer" causing all activity in a database. Regarding Session: a Datamodel... Aim is currently to find heavy processes and heavy queries.  Spotting underlying tabblets / tables may/should follow from that.  But other may be more interested to dive directly into the storage-layer  (as thew metrics on port 9000 seem to focus on rocksdb) Central, I think, is the "Session". as identified from from pg_stat_activity and from. the ps -ef list on the host. I then built a number of entities (tables) around the Session with the aim of collecting data. Relevant Data (I hope).  Metrics... I did get lost a bit in the huge amout of text coming from ports 7000 and 9000. They seem to provide a lot of rocks-db and program/process info. But I could not (yet) rel...

[Draft] Yugabyte ASH notes and suggestions.

Image
[DRAFT, not for wider publication] TL;DR: Request for adding ID fields to yb_active_session_history. First, use the tablet_uuid instead of the first string-part of the uuid. Furthermore, add IDs to identify the descriptive texts (but keep the text for human readable). And finally consider defining the Root-request-ID as a separate entity (possibly another view: yb_root_request).  Elaborate .. So far I have created a table to store yb_active_session_history records. The columns in the table are copies of the columns from the view, with two additions: id and host. The id comes from  sequence, and the host is the $HOSTNAME of the node where the tserver runs, e.g. where the record is collected (in future, I would use tsrv_uuid). My Ash records are "under development", but this is my latest: I also built a stored-function to capture the records, which was made to run on every node (every tserver) with 1 or 3 or 10min intervals (insert where not exist...). The resulting data can be...

[Draft] Postgres - Yugabyte: logging of sessions, and (active-) session-history

Image
[DRAFT - for discussion only]  TL;DR: After examining the possibilities of pg_stat_... and combining it with yb_active_session_history (ASH), I have some ideas and suggestions to help with finding hotspots and heavy statements. Background: My unstoppable urge to investigate databases via SQL, and a focus on "knowing what happens" with connections and queries. Philosophy: Queries are the root of all (user-)activity and (user-)problems. Queries come from application-connections or sessions. And in a Distributed Database (DD), the sessions and their queries can cause work on any node in the cluster. Hence you need to be able to "track them down".  In PostgreSQL we have pg_stat (_activity, _statements) for that. Yugabyte added a feature called Active Session History (ASH), and I am combining that with information from pg_stat_activity and pg_stat_statements to try and identify "heavy queries" and relate them back to session, and thus to users and applications....

Logging Performance-Information in a Distributed Database

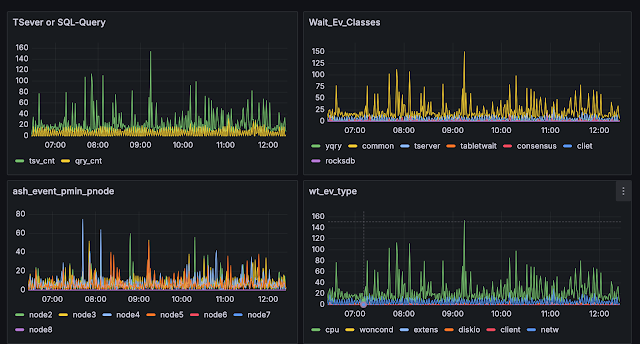
 TL;DR:  We store the yb_Active_Session_History (ASH) data in a table, whereby every node inserts its own data. To see data from other nodes, we query the table. We tried to minimize the inter-host communiction and avoid additional mechanisms like FDW or dedicated RPCs. And we keep the data (history) for possible future usage. The main disadvantages are that (1) there is "insert activity", (2) that here is a possible delay due to the sampling-interval, and (3) this concept depends on the correct working of most of the components on a node. Background: Keep History. When using Yugabyte (link), a distributed database, and trying to keep track of the workload-history, e.g. the performance-data, Postgres and Yugabyte make internal data available via views, and notably YB added the view yb_active_session_history. This data can be used to find bottlenecks and hotspots in your system. You can find the (first version of) ASH documentatin here: https://docs.yugabyte.com/preview/explor...

Monitoring a Disributed Database (notes)

[not published yet - need more work in "locally available" and "need to combine"] TL;DR: Keeping an eye on a database that runs on multiple servers (nodes, containers....), possibly in different locations challenging. An SQL-database with logging-data will help. I'll describe two possible mechanisms with some pros and cons. Background: The Distributed database, multiple nodes. Distributed, hence it runs on multiple servers (or containers, or whatever entity that can provide the compute + memory + storage you need). The processing of calls, queries is also distributed.  And any given SQL, even if it concerns just 1 records, is likely to touch several nodes: Query, Catalog, Storage, Consensus, Master, Replicas... And a query that uses joins and filters, and thus touches muliple tables and many records, is bound to need calls, RPCs, to several nodes. This is illustrated by the fact that the  "explain-plans" of both Yugabyte and Cockroach are already more ...

Distributed - but when do we over-react

[DRAFT!]  TL;DR: Distributing a Database helps with Sharding and Resilience. But do I really want my data spread out over 10s or 100s of "nodes" ?  Background. Been investigating Distributed Databases. Finding: Scale out means Fragmentation of Data. Adding nodes to a cluster can help to improve both  Resilience,  by having at least 2 spare copies and a voting mehanism, and  Scalability,  by adding more workers, more CPU, more memory. But the downside that I see (or imagine) is that my data gets too fragmented, too much spread out.  Solution: Shared Disks ?  For Resilience, I would prefer to keep 3, 5, or maybe even 7 copies of my data. But not more.  Too many copies mean too much overhead on writing and voting. For Sharding, I want the data spread, but not fragmented over separated storage components any more than necessary. For some "scale out" situations, I may want more CPU and more Memory, but maybe not a further fragmentation of my data ...

Testing CockroachDB, more on Resilience ...

Image
 TL;DR: I'm simulating the faillure of more than 1 node and find some weird behaviour ? I'm learning how to operate a cluster. Repair is not always completely automatic? Spoiler: The cluster can remain Resilient, but you need to keep monitoring your cluster closely. There are some things I cannot quite explain, yet.  Do I need to RTFM more ?  => Edit: Yes. See answer to question below. Background: Distributed Databases are Resilient. I'm experimenting with a distributed database, where every data-item is replicated 3x (replication factor of 3) over a 3 node cluster. Data remains "available" as long as every object has a quorum, in this case 2 votes out of 3.  From previous experiments (link), I already know that an outage of 1 node is not a problem, but an outage of 2 nodes out of 3 is fatal. In previous experiment I showed how I could "fix" the loss of a single node by adding another, fourth, node to the cluster to bring the cluster back to 3-nodes a...